Cost Allocation Among Funding Agencies
In our last NADTC blog , guest blogger Steve Yaffe discussed how more paratransit rides can be provided within budgetary limitations if paratransit operations and accounting are structured as a shared service, with costs proportionately allocated to each funding source. In this second blog of the series, we continue to look at paratransit cost-allocation, with a specific focus on how to split costs proportionately and fairly among funding agencies.
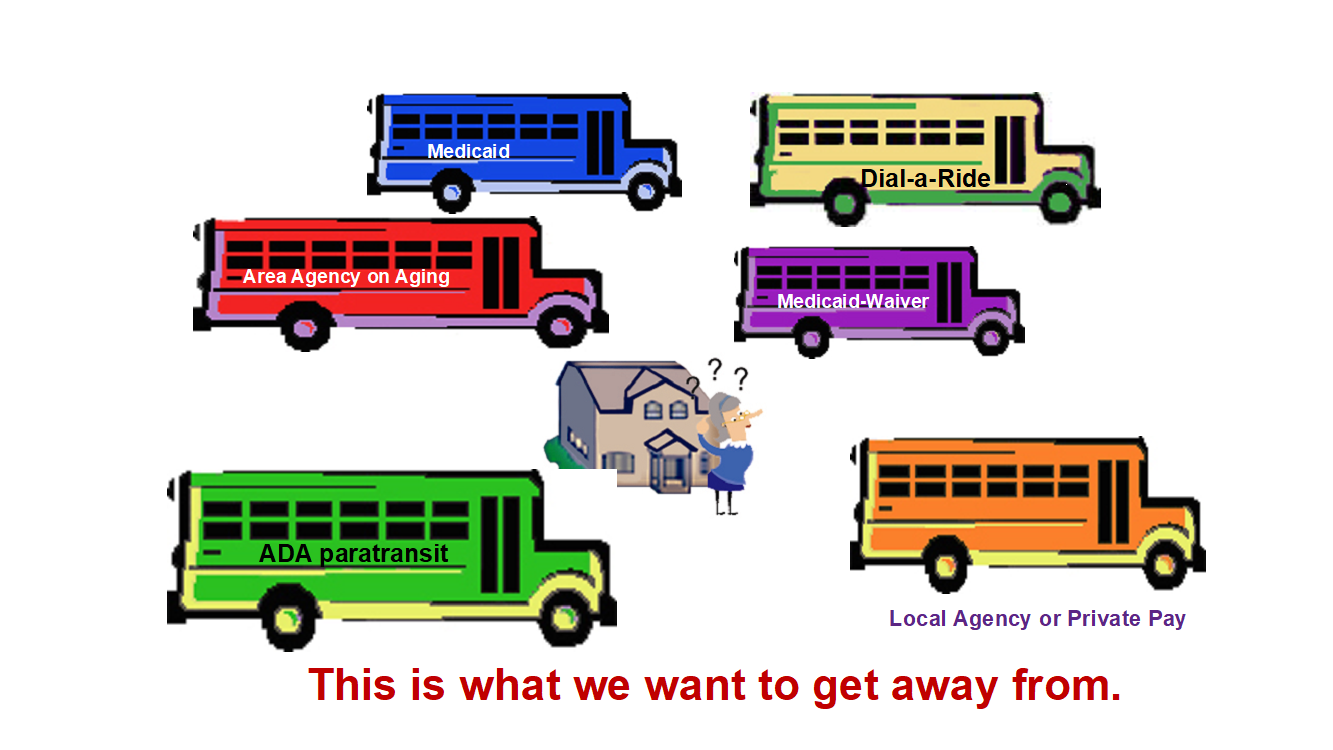
Before grouping riders sponsored by different funding sources on the same vehicle, the funding agencies need reassurance that the costs will be divided fairly. This methodology can be adapted to any paratransit computer-aided scheduling software if (a) the software includes at least one funding agency field in each client file and (b) assigns one of the funding codes that client is authorized to use to each trip. Once coded into the software, this methodology isn’t time-consuming to process. However, only very small transportation providers (just a few vehicles) would want to do this manually or in Excel. The end result of this process could look like this:
 1. Costs can be allocated in two ways: using a single overall cost per hour or separately using a peak cost per hour and off-peak cost per hour.
In the previous blog, described how to segregate and sum costs in the three categories in which they accrue: driver-related costs by vehicle service hour; maintenance and fuel costs by vehicle mile; and fixed/overhead costs summed on a monthly basis and then divided by peak vehicle.
To have only one overall rate per hour, sum the projected total annual costs for each of these three categories and then divide by service hours.
To offer separate rates for peak period and off-peak, then;
(a) Separate funding code differentiating off-peak from peak service for that funding agency must be assigned to each trip; and
(b) The operator must know the proportion of peak vehicle hours offered of total vehicle hours. Peak vehicle hours accrue when most of the required peak period vehicle assignments are in service on a typical weekday. In this example, the number of vehicles in service (from first pickup to last drop-off) 6:00 – 9:00 AM and 3:30 – 7:00 PM is 30. The number of vehicles in service in between (9:00 AM – 3:30 PM) is 10. No service is offered at night or on weekends. Total weekday service hours can be roughly calculated as (30*6.5) + (10*6.5) = 260, of which 75% is during peak periods. If service is also provided on Saturdays and minor holidays 6:00 AM – 7:00 PM with five vehicles, then one has to include the number of weekdays and Saturdays per year. The formulas are then changed to (30*6.5*250) + (10*6.5*250) + (5*13*57) = 68,705, of which 71% is peak service.
(c) In this scenario, the overall rate for off-peak hour would be: the sum of variable cost line items (subtotal of revenue hour and mileage-accrued costs) * percent of off-peak service hours, then divided by off-peak hours (total revenue hours * percent of off-peak service hours). Lets assume that labor and other driver-related expenses add up to $700,000 for 17,500 service hours; maintenance and other mileage-related expenses add up to $180,000; and 35% of service hours are off-peak (6,125). The off-peak cost per hour would be $50.29.
(d) The overall rate for peak hour would be: fixed costs plus (subtotal of revenue hour and mileage-accrued costs) * percent of peak service hours (total revenue hours * percent of peak service hours) divided by peak hours (11,375). The peak cost per hour would be $57.14. The off-peak cost per hour would be $6.85 or 12% less than the peak cost.
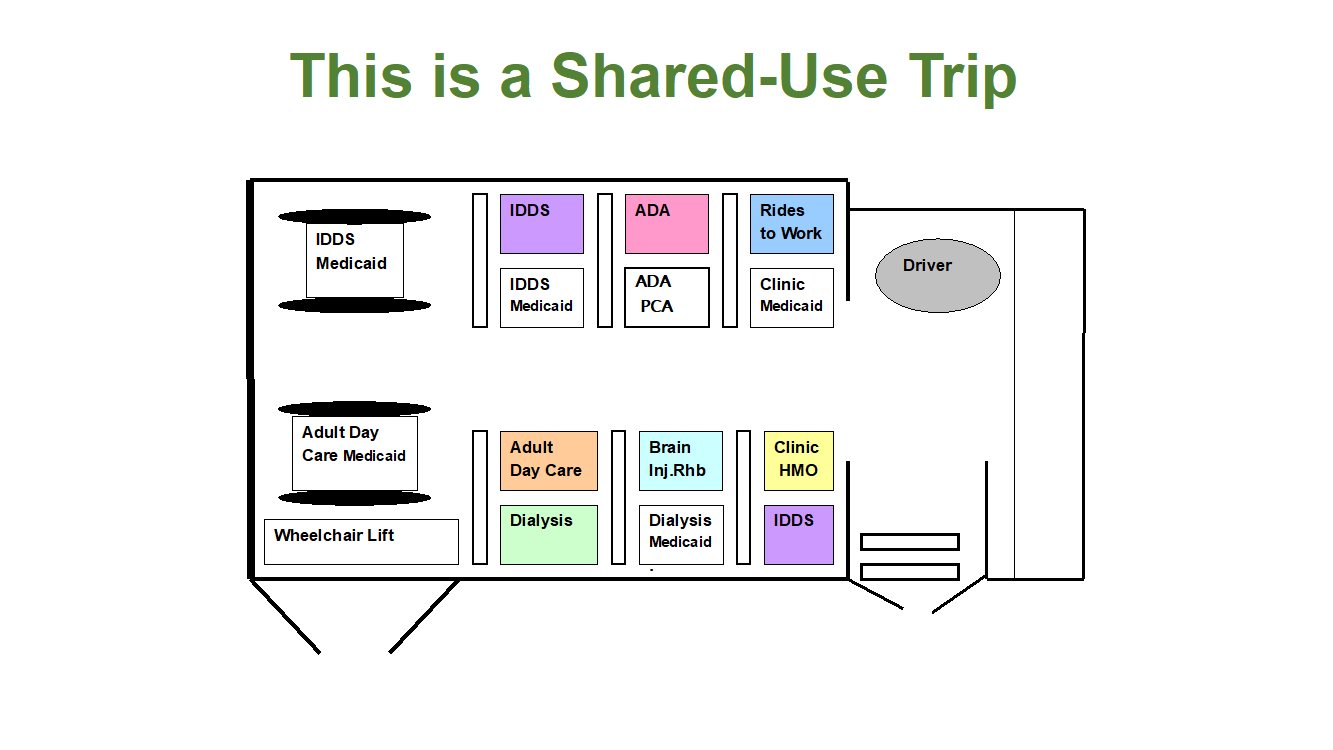
2. In either scenario, costs are allocated to the funding agencies according to the proportion of ride time that their clients accrue on the vehicle.
Transportation costs are split on a proportional basis, according to each agency’s share of the cumulative travel time. The process is based on each vehicle assignment for the day, dividing the minutes between each consecutive pair of stops among the agencies sponsoring clients on-board. If ten minutes elapse between a pickup or drop-off and the next stop (also pickup or drop-off) and a senior center participant and dialysis patient are on-board, the senior center or Agency on Aging would be charged five minutes and the organization sponsoring the dialysis patient would be charged the other five minutes.
Daily ride time for that vehicle is summed by agency. Non-revenue time where no one is on-board is divided proportionately according to the percentage of ride time allocated to each agency. In this process, the sum of the minutes assigned to the sponsoring agencies is equal to the sum of vehicle revenue and non-revenue time. The software sums these data for the month and provides reports to each sponsoring agency of chargeable time as well as the number of rides per agency client accrued.
If one overall rate per hour is used, that rate is applied to each agency’s subtotal of vehicle time used – not the length or duration of individual client rides, agency passenger miles or passenger minutes.
If separate rates for peak and off-peak service are used, the off-peak rate is applied to each agency’s subtotal of vehicle time used as discussed in the above paragraph. The fixed cost rate (fixed costs divided by peak hours) is applied only to the subtotals for peak period funding codes.
3. Use of these three categories for cost allocation will:
- Enable shared use of vehicles by private-pay riders as well as subsidized riders, regardless of the funding source, to enable the provision of more rides within budgetary limitations while using vehicle capacity more effectively. I’ll be discussing cost-allocation to customers further in my next blog.
- Enable and encourage sequential use of vehicles including in off-peak hours during the provider’s span of service, as an extra charge for fixed costs would not be appropriate. Those costs would be charged for peak period service, as system capacity is sized for peak period service.
- Enable customers to reduce expenses by scheduling rides and activities inside or outside peak travel times. For example, senior center rides could be scheduled to arrive at 10:00 AM and depart at 2:00 PM.
Key Performance Indicators:
- Peak to Base Ratio – average weekday number of peak vehicles in service vs. off-peak service. A ratio of 3:1 clearly delineates unused capacity.
- Rides provided per $100,000 of expenditure provides funders with a Key Performance Indicator (KPI) of bang per buck.
- Rides provided for $100,000 of expenditure for each funder, to provide a cost per ride just for that funding program (that same KPI just for each funder).
- Hours of service per peak vehicle and
- Rides provided per peak vehicle are internal KPIs showing how intensely resources are being used.
Your comments to these blogs are welcome – please email the author at yaffe@YMobility.info.
Steve Yaffe is an independent consultant and a contractor for the National Aging and Disability Transportation Center. He draws upon 40 years’ experience planning, procuring, overseeing and evaluating demand response and fixed route transit services, including 16 years with a consolidated human service transportation program. He has served on research panels and co-chaired the 2019 Transportation Research Board’s International Conference on Demand Responsive and Innovative Transportation Services.