Paratransit Cost Allocation
Thank you to guest blogger Steve Yaffe for writing this month’s blog series on demand response transportation design and operations. The following is the first in a series of seven blogs highlighting the need for cost allocation, transit scheduling and technology. This blog focuses on how more paratransit rides can be provided within budgetary limitations if paratransit operations and accounting are structured as a shared service.
More paratransit rides can be provided within budgetary limitations if paratransit operations and accounting are structured as a shared service, with costs proportionately allocated to each funding source. Sponsoring agencies would allow customers who are traveling from the same area, in the same direction, at the same times, to ride together. Funders could also share use of vehicles by blocks of time to take advantage of unused vehicle capacity during off-peak periods.
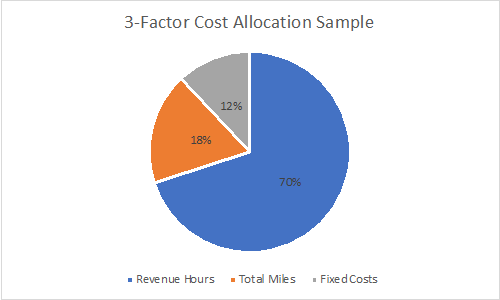
1. The foundation of cost allocation is the assignment of each cost line-item to one of three functional categories: Revenue Hours, Total Miles, or Peak Vehicle Requirement.
As noted in Chapter 6 of the toolkit in TCRP Report 144, Sharing the Costs of Human Services Transportation (Burkhardt et al., 2011), “Variable costs can be logically linked to either one of two service variables: hours or miles. For example, the number of vehicle hours is directly related to most of the operator labor costs because driver expense is a function of the amount of time that vehicles are in operation. The number of miles accounts for most maintenance labor and materials costs, as well as the cost of fuel consumed and vehicle depreciation. Fixed costs are the expense items that do not vary with the number of miles or hours of operation but, instead, reflect the scale or size of the agency. Examples include administration and building rents.”
Allocating costs to these three categories enables transportation providers to understand and quantify the impacts of adding or discontinuing individual service contracts; expanding or contracting the geographic service area; or extending or reducing the span of service. Costs in the two variable categories (hours or miles) increase or decrease directly with street operations. Driver salaries, benefits, recruiting/training costs and uniform rental, increase or decrease with the number of service hours. When preparing an annual budget, the transit manager would estimate the annual cost in each of these cost categories (including a percent increase to cover salary changes as staff gain experience), sum, and divide by the expected number of vehicle service hours.
The cost of fuel, parts, fluids, tires and maintenance technician hours increase or decrease directly along with the miles driven. The driver-related unit cost per service hour and the maintenance-related cost per mile driven won’t vary by service time of day or day of week. Again, when preparing an annual budget, the transit manager would estimate the annual cost in each of these cost categories, sum, and divide by the expected number of vehicle miles. An inflation factor would be applied to cover expected salary increases or increases in parts, fuel and fluids. Expected annual vehicle miles can be estimated from the previous year by dividing the sum total of revenue fleet vehicle miles by the annual revenue vehicle service hours – then applying that average speed factor to the expected annual revenue vehicle service hours in the coming year.
Fixed costs would be estimated for the upcoming year and divided by the weekday peak vehicle requirement, as facilities and managerial overhead are sized by the peak vehicle requirement. Fixed costs include: either vehicle lease payments or an amortization charge towards vehicle rehabilitation or replacement; the salaries and benefits of managerial staff including dispatchers, supervisors and clerical; facility rent and maintenance; vehicle insurance rates; technology license and other fees; taxes; and line items for profit and corporate support. When developing an annual budget, adjust fixed costs by a percentage to account for annual increases in managerial salaries, rent and other line-items and by steps for major changes in the span of service or the geographic service area or by a significant change in the peak vehicle requirement. The size of those steps is determined by the number of supervisors and dispatchers required as well as vehicles and facilities.
While the charge for every new service must include the hourly or mileage-related variable costs, off-peak service during the current span of service will not affect fixed costs. Vehicle insurance, facility rent, software license fees and vehicle amortization won’t change. The number of dispatchers or street supervisors won’t change. The salaries of the transit manager, as well as the operations, maintenance and safety managers will not change. By not charging fixed costs to midday service, operators can attract more business without adding capacity. Additional midday business enables more drivers to work straight shifts, retaining talent.
However, expanding the span of service to include evenings and/or weekends will impact fixed costs. While variable costs tend to change along a straight diagonal line, fixed costs tend to remain level unless they go up (or down) vertically as a step.
![]()
![]()
Significantly expanding the service area will impact fixed costs. In both scenarios, in an urban/suburban setting, more street supervisors will be needed. A major increase in service for a new jurisdiction may require another operating base, entailing more facility rent as well as management oversight. If the peak vehicle requirement jumps beyond the capacity of one dispatcher, a second will be needed to ensure driver readiness, while the first dispatcher devotes attention to communications.
2. Use of these three categories for cost allocation will:
- Enable shared use of vehicles by private-pay riders as well as subsidized riders, regardless of the funding source, to enable the provision of more rides within budgetary limitations while using vehicle capacity more effectively. I’ll be discussing cost-allocation to customers further in my next blog.
- Enable and encourage sequential use of vehicles including in off-peak hours during the provider’s span of service, as an extra charge for fixed costs would not be appropriate. Those costs would be charged for peak period service, as system capacity is sized for peak period service.
- Enable customers to reduce expenses by scheduling rides and activities inside or outside peak travel times. For example, senior center rides could be scheduled to arrive at 10:00 AM and depart at 2:00 PM.
Key Performance Indicators:
- Boardings per vehicle service hour – or per service mile for rural systems. This is a Key Performance Indicator (KPI) to measure the efficiency of scheduling and street operations. To be accurate, this calculation should be based on actual pickup times. Urban/suburban systems usually find that boardings per vehicle service hour is more meaningful, as the routing for the same trip can change daily given traffic conditions.
- Cost per ride provided is a good internal KPI, but not useful for funders in evaluating the value of their expenditure.
- Rides provided for $100,000 of expenditure provides funders with a KPI of bang per buck.
- Hours of service per peak vehicle and;
- Rides provided per peak vehicle are internal KPIs showing how intensely resources are being used.
Further Reading on three-category cost-allocation for demand response transit:
- Steve Yaffe. “Paratransit Cost-Allocation Model Adjustments to Promote Agency Ridesharing and Vehicle Timesharing” In Paratransit: Shaping the Flexible Transport Future. Published online: 28 Sep 2016; 127-152.
- Transit Cooperative Research Program. (2011a). TCRP Report 144: Sharing the Costs of Human Services Transportation, Volume 1: The Transportation Services Cost Sharing Toolkit.
- Transit Cooperative Research Program. (2011b). TCRP Report 144: Sharing the Costs of Human Services Transportation, Volume 2: Research Report.
The next blog in the series will describe a method to split costs proportionately among funding agencies. Your comments to these blogs are welcome – please email the author at yaffe@YMobility.info.
Steve Yaffe is an independent consultant and a contractor for the National Aging and Disability Transportation Center. He draws upon 40 years’ experience planning, procuring, overseeing and evaluating demand response and fixed route transit services, including 16 years with a consolidated human service transportation program. He has served on research panels and co-chaired the 2019 Transportation Research Board’s International Conference on Demand Responsive and Innovative Transportation Services.